Gnuplot 5.4.9 🞉
Visualize mathematical functions and data interactively.
cd Ports/gnuplot
./package.sh
 This description was automatically generated by ChatGPT. Feel free to add a accurate human-made description!
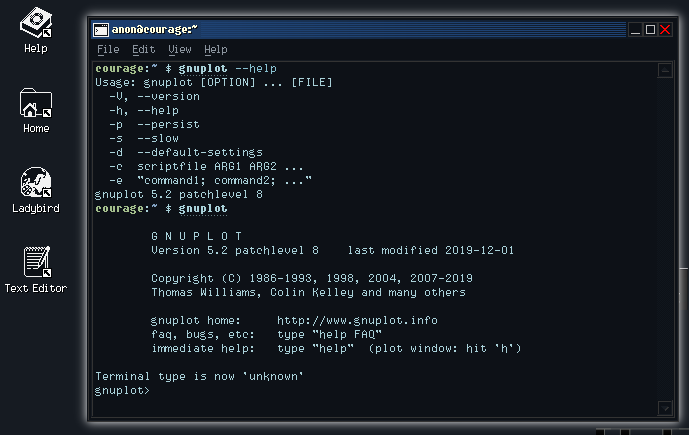
Gnuplot is a command-line program used for creating graphs and plots of data sets. It was originally created in 1986 by Thomas Williams and Colin Kelley as a tool for plotting data from a variety of sources. Gnuplot is widely used in the scientific and engineering communities for data analysis and visualization, and is available on most computing platforms, including Linux, macOS, and Windows.
Gnuplot uses a simple script language for defining plots, which allows for a high degree of customization and automation. It supports a wide variety of plot types, including 2D and 3D plots, histograms, and scatter plots, among others. Gnuplot also allows for easy manipulation of data, including sorting, filtering, and transforming data sets, as well as merging multiple data sets.
Gnuplot has a large and active user community, which has contributed to the development of many plugins and extensions for the program. In addition, Gnuplot is often used in conjunction with other scientific and engineering software tools, such as MATLAB, Python, and R, for data analysis and visualization.
Website: http://www.gnuplot.info/
Port: https://github.com/SerenityOS/serenity/tree/master/Ports/gnuplot
Similar ports
Port icon has the following license: Copyright 1986 - 1993, 1998, 2004 Thomas Williams, Colin Kelley https://sourceforge.net/p/gnuplot/gnuplot-main/ci/master/tree/Copyright